

Monitor your Elasitcsearch Cluster with Grafana and Prometheus
Table of contents
Monitoring Elasticsearch Cluster is necessary and important for both testing and production. Kibana and Grafana are awesome tools for monitoring and visualization. In this post, I’ll introduce how to monitor Elasticsearch Cluster by using Grafana with datasource is Prometheus.
1. Requirements
- Grafana: awesome tool for visualization.
- Prometheus: best datasource for Grafana.
- Elasticsearch Exporter: export metrics from Elasticsearch to Prometheus.
- Elasticsearch Cluster: cluster we want to monitor.
The following image is the architecture how we setup

2. Grafana Dashboards
I published my dashboards to Grafana Dashboards so you can easily import these dashboards to your Grafana.
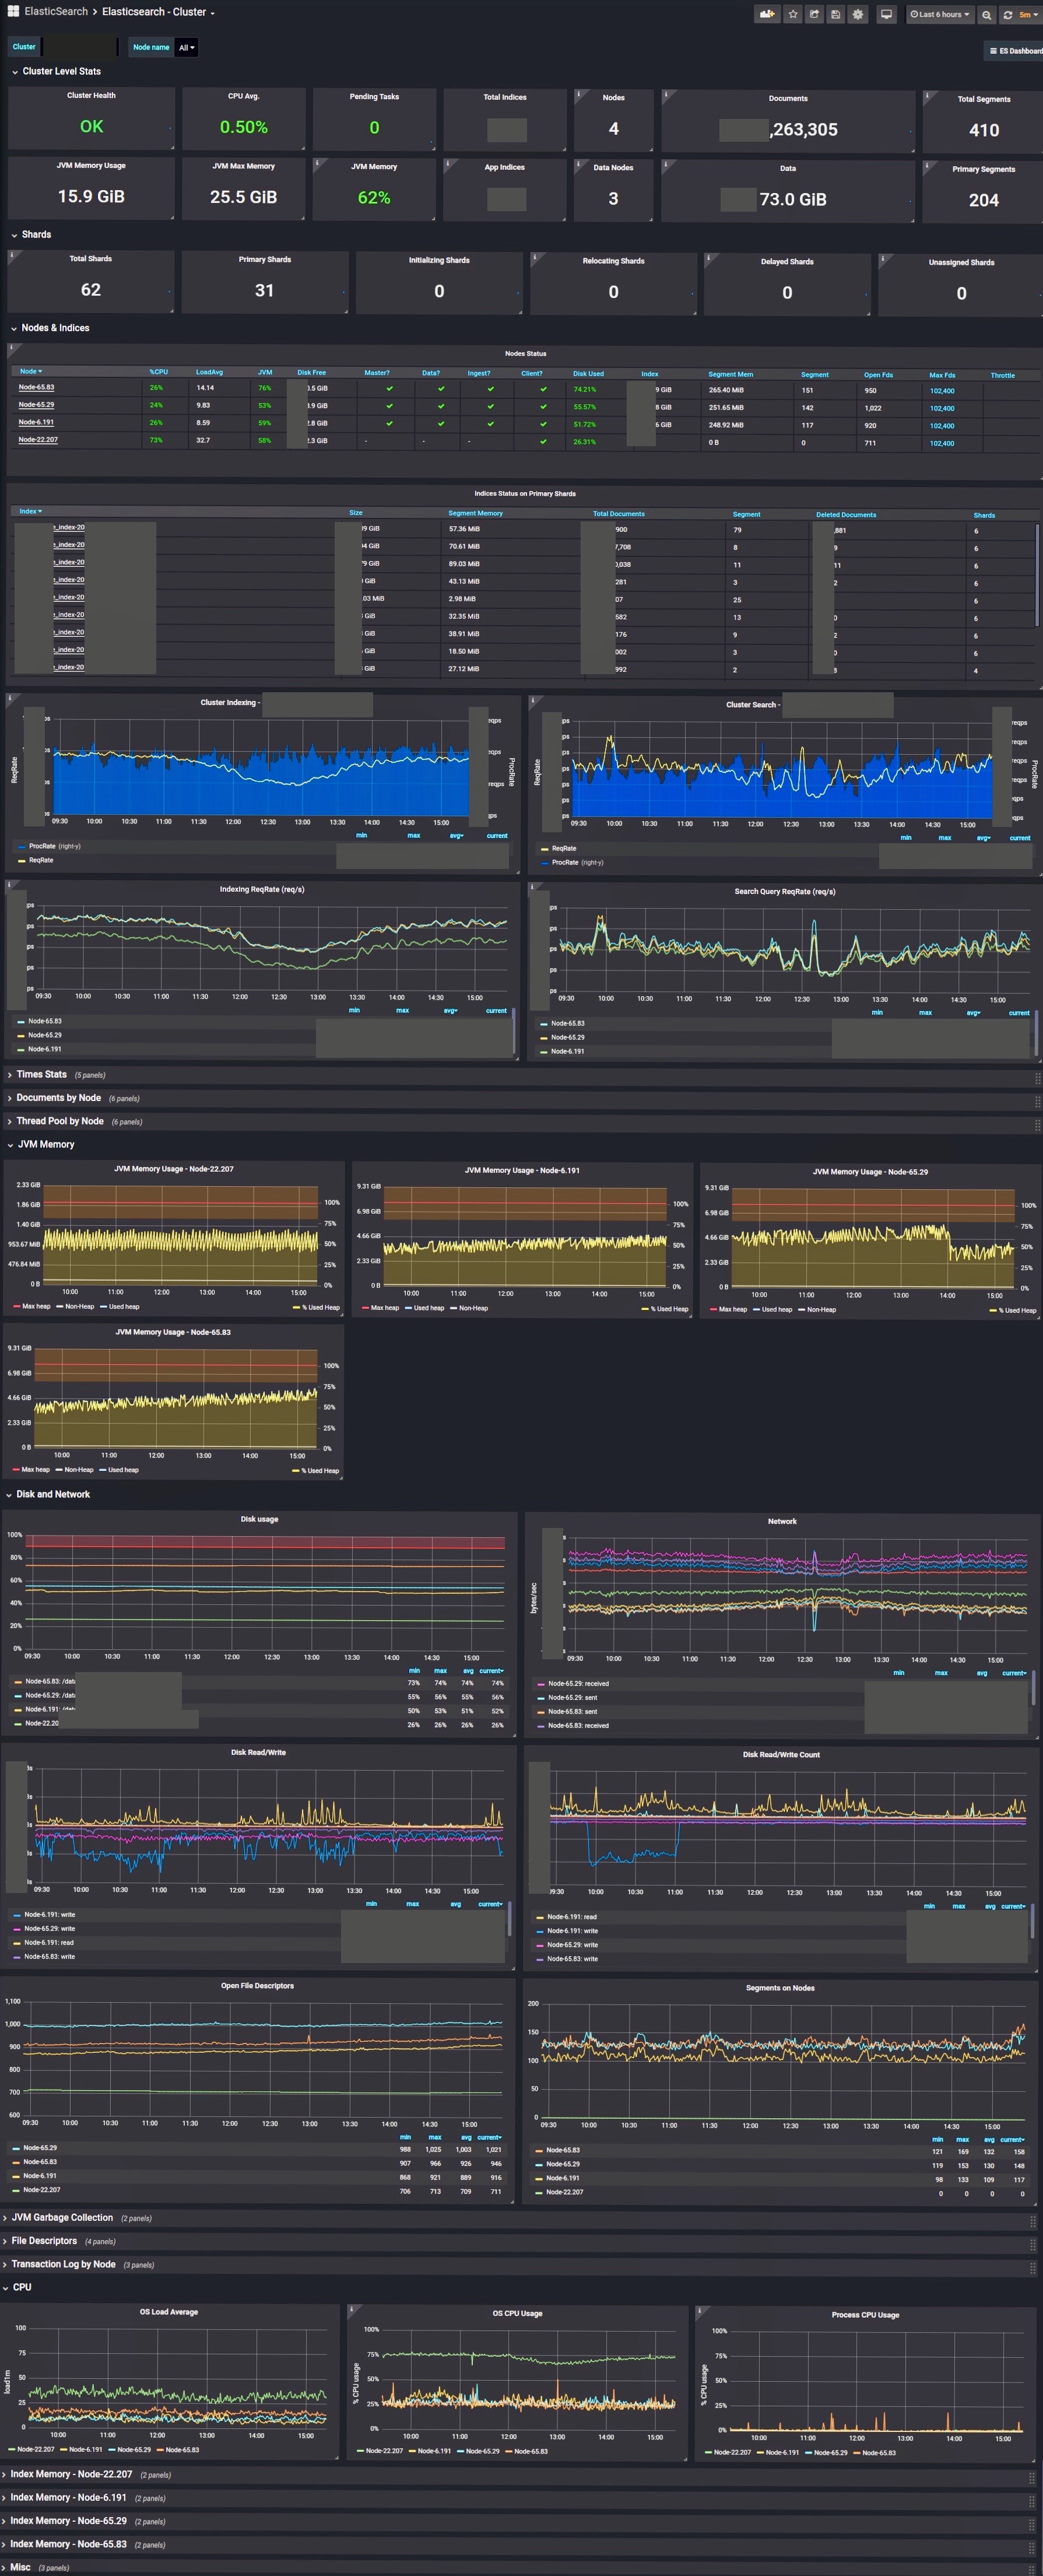
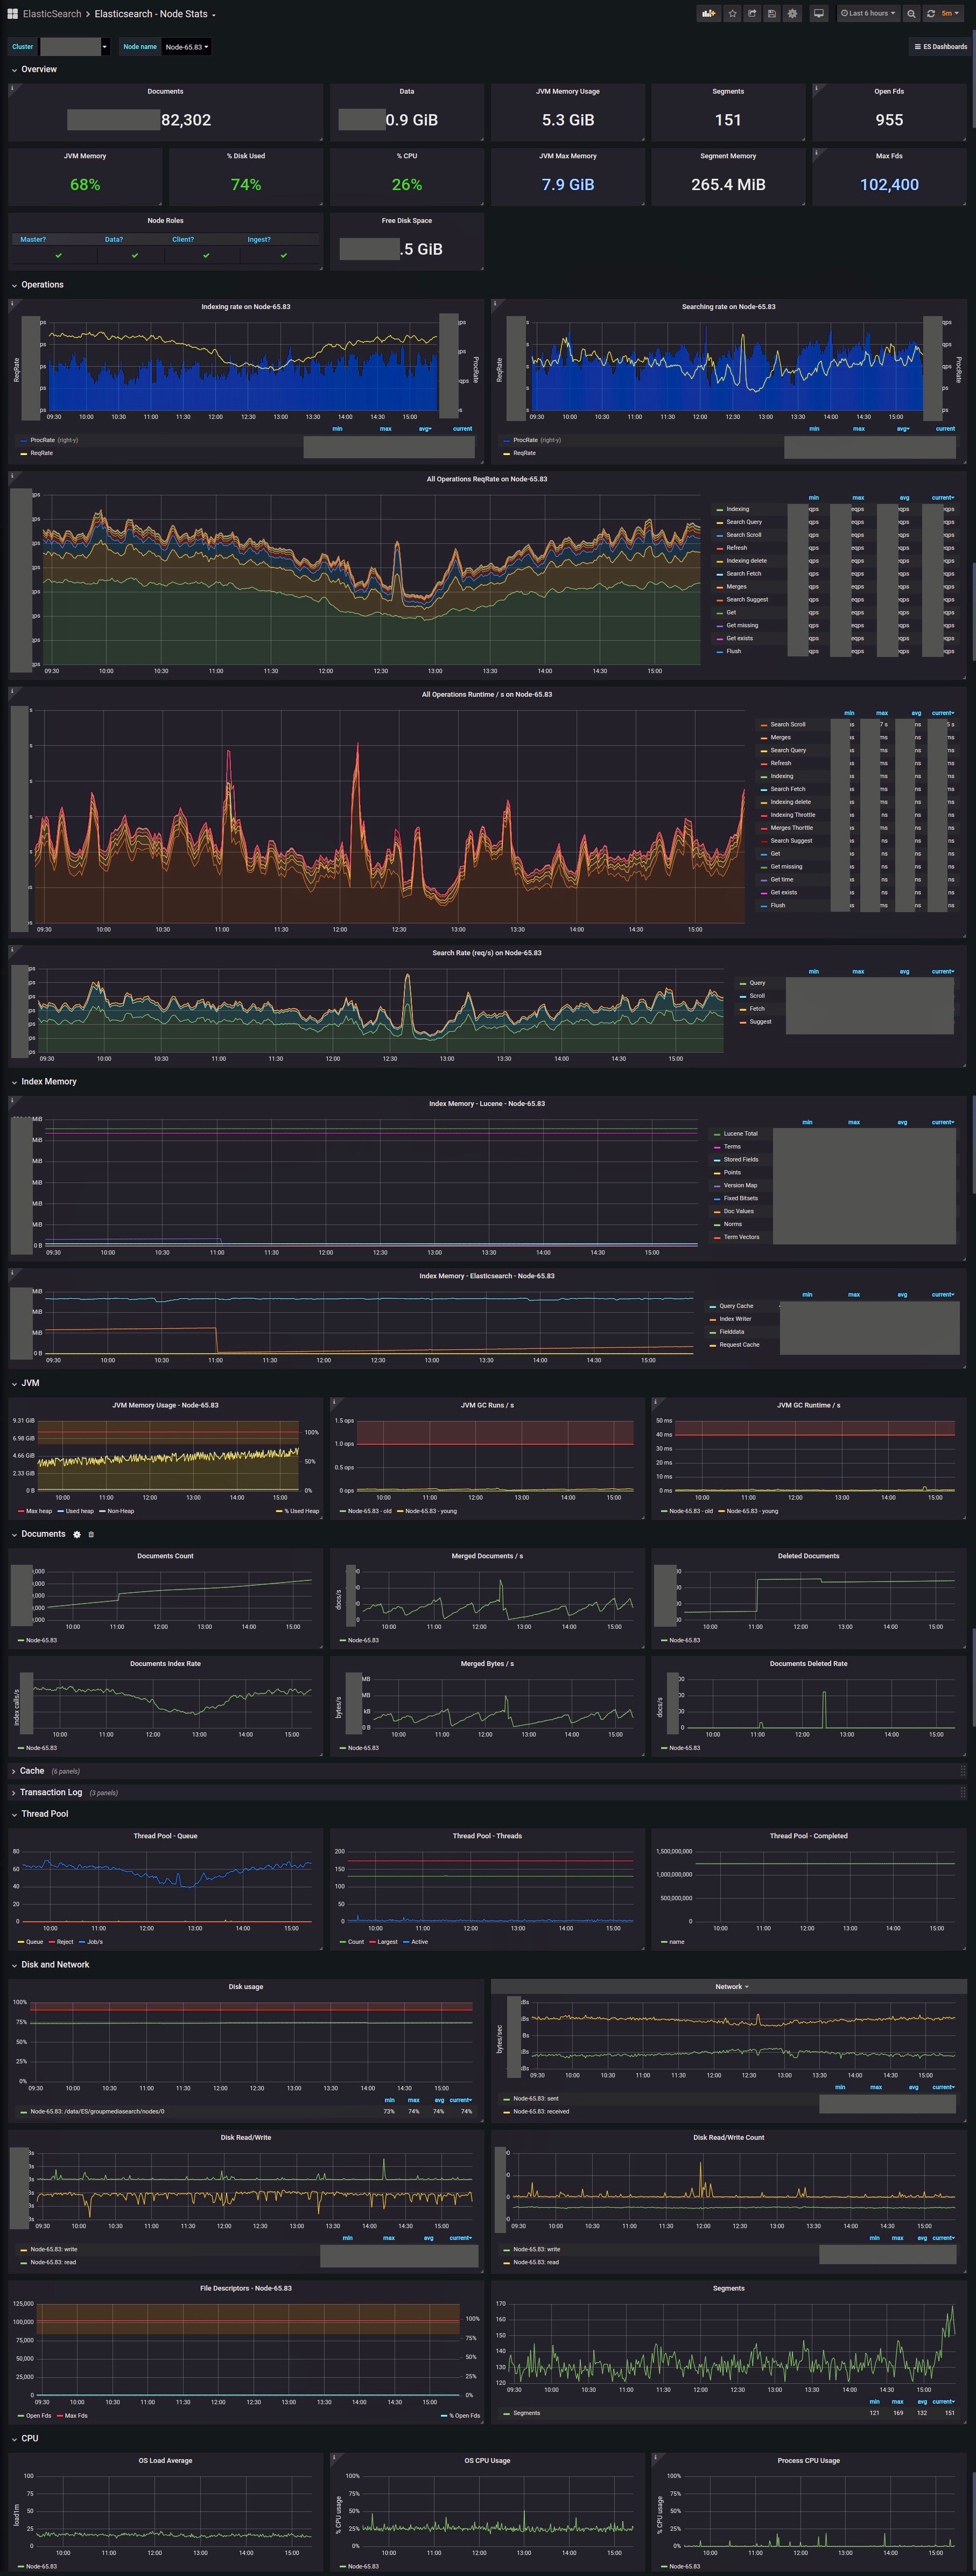
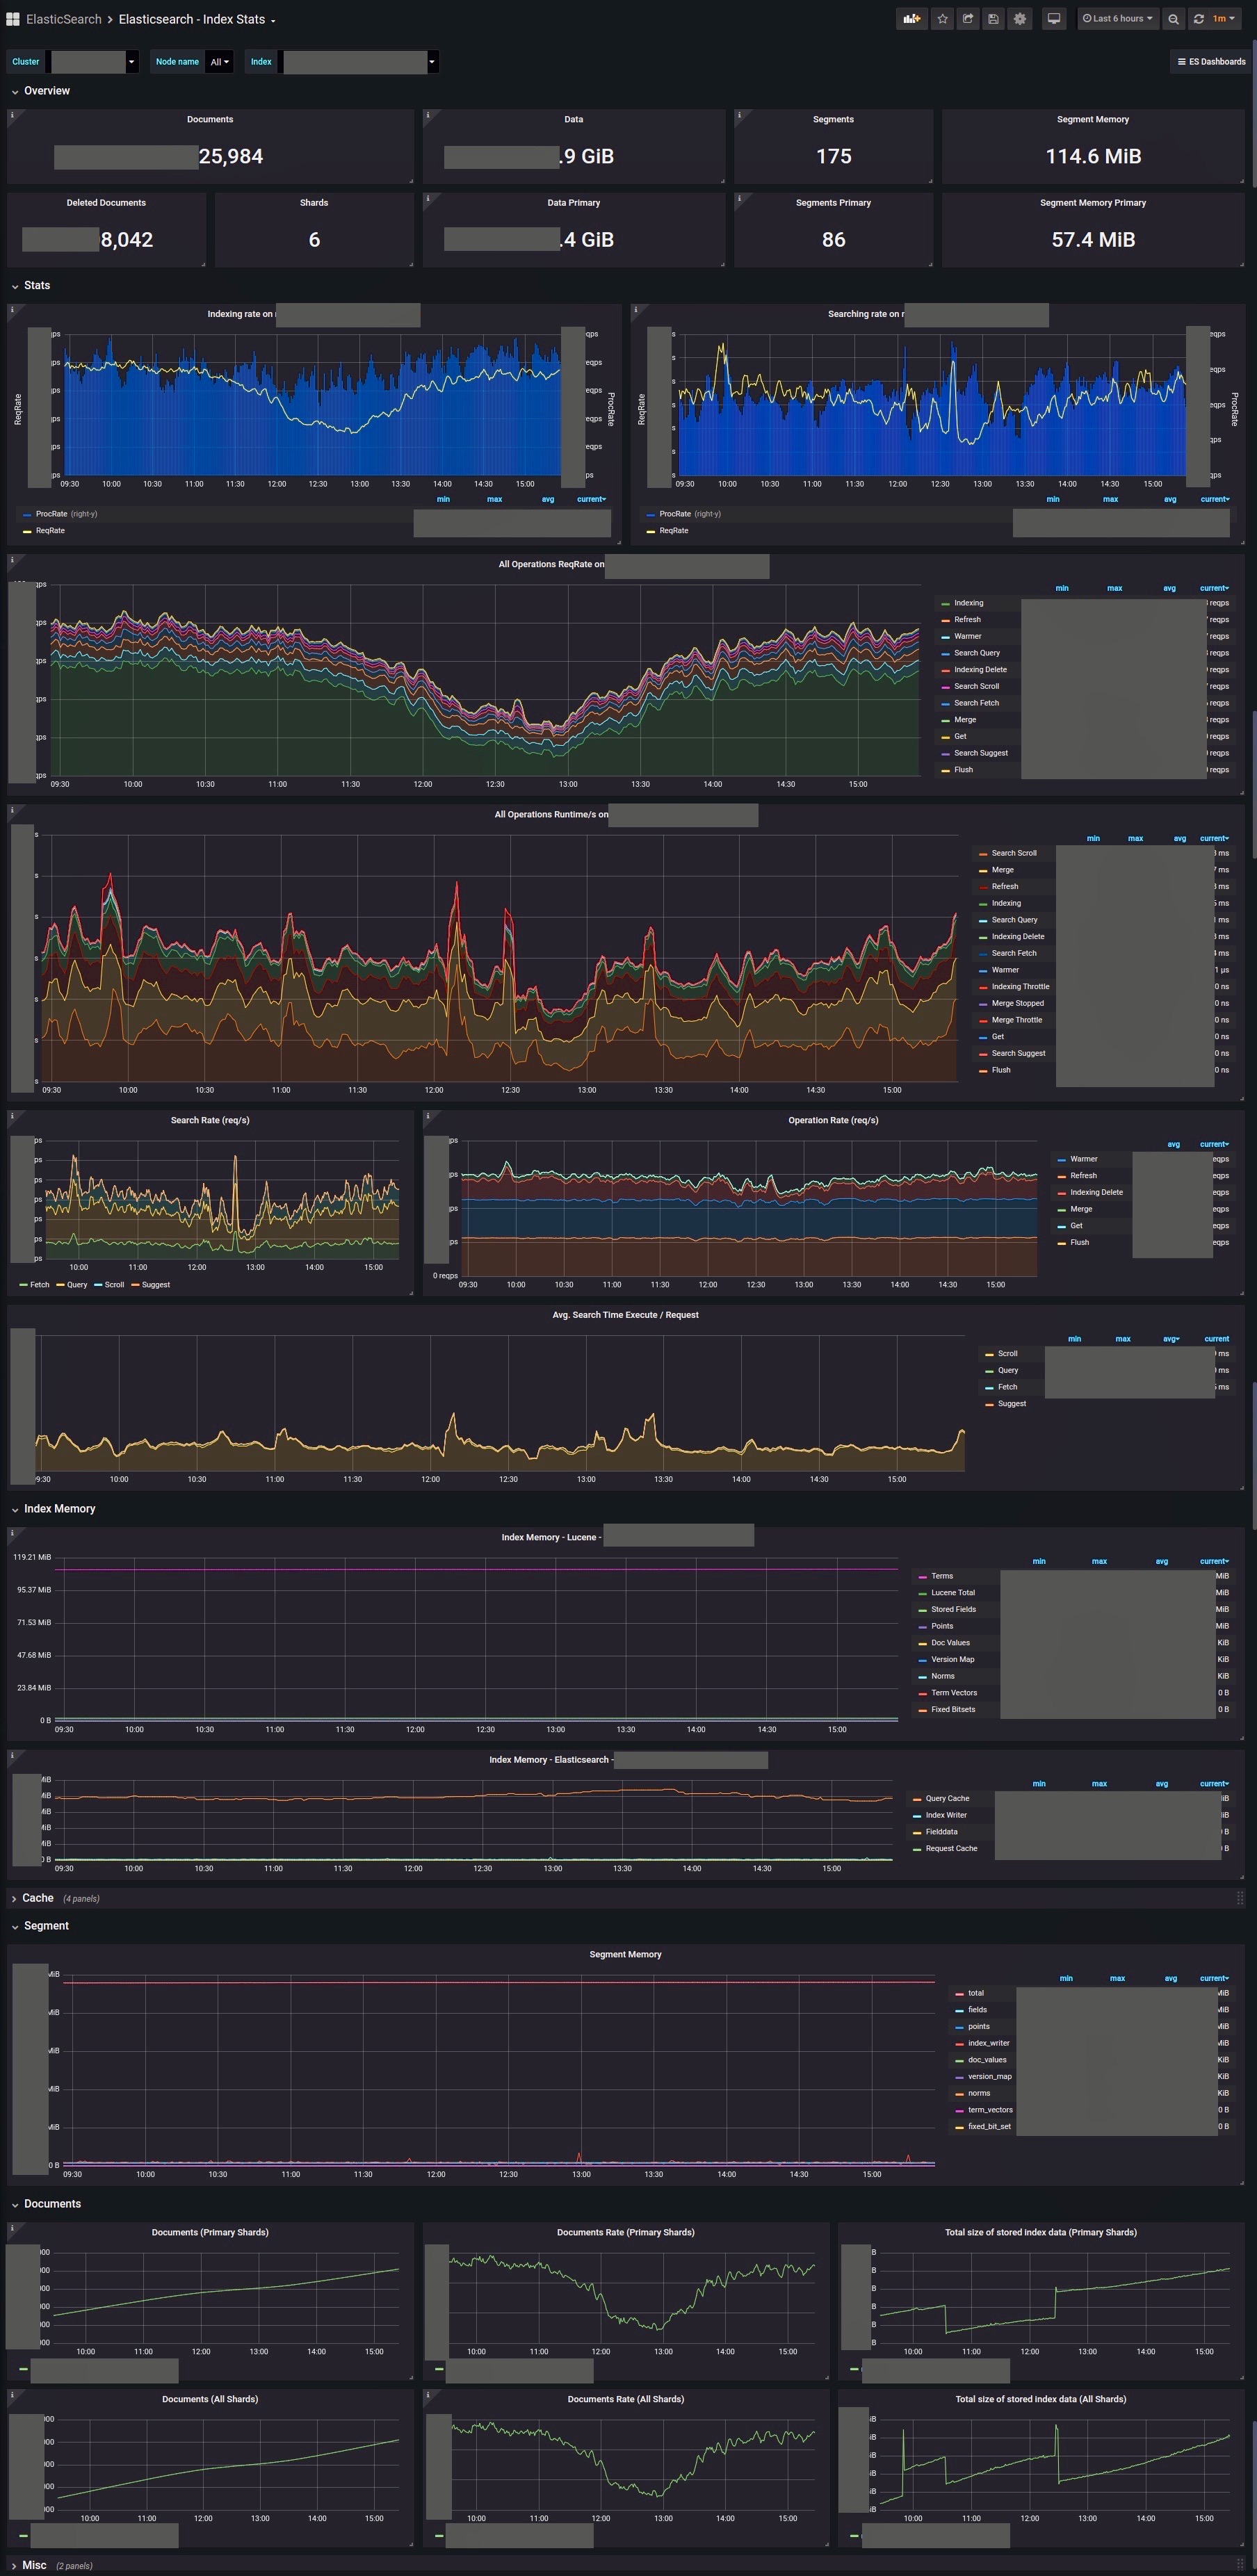
13071: Dashboard for Elasticsearch Cluster Stats13073: Dashboard for Elasticsearch Node Stats13072: Dashboard for Elasticsearch Index Stats13074: Dashboard for Elasticsearch History Stats
2.1. Cluster Stats Dashboard
2.2. Node Stats Dashboard
2.3. Index Stats Dashboard
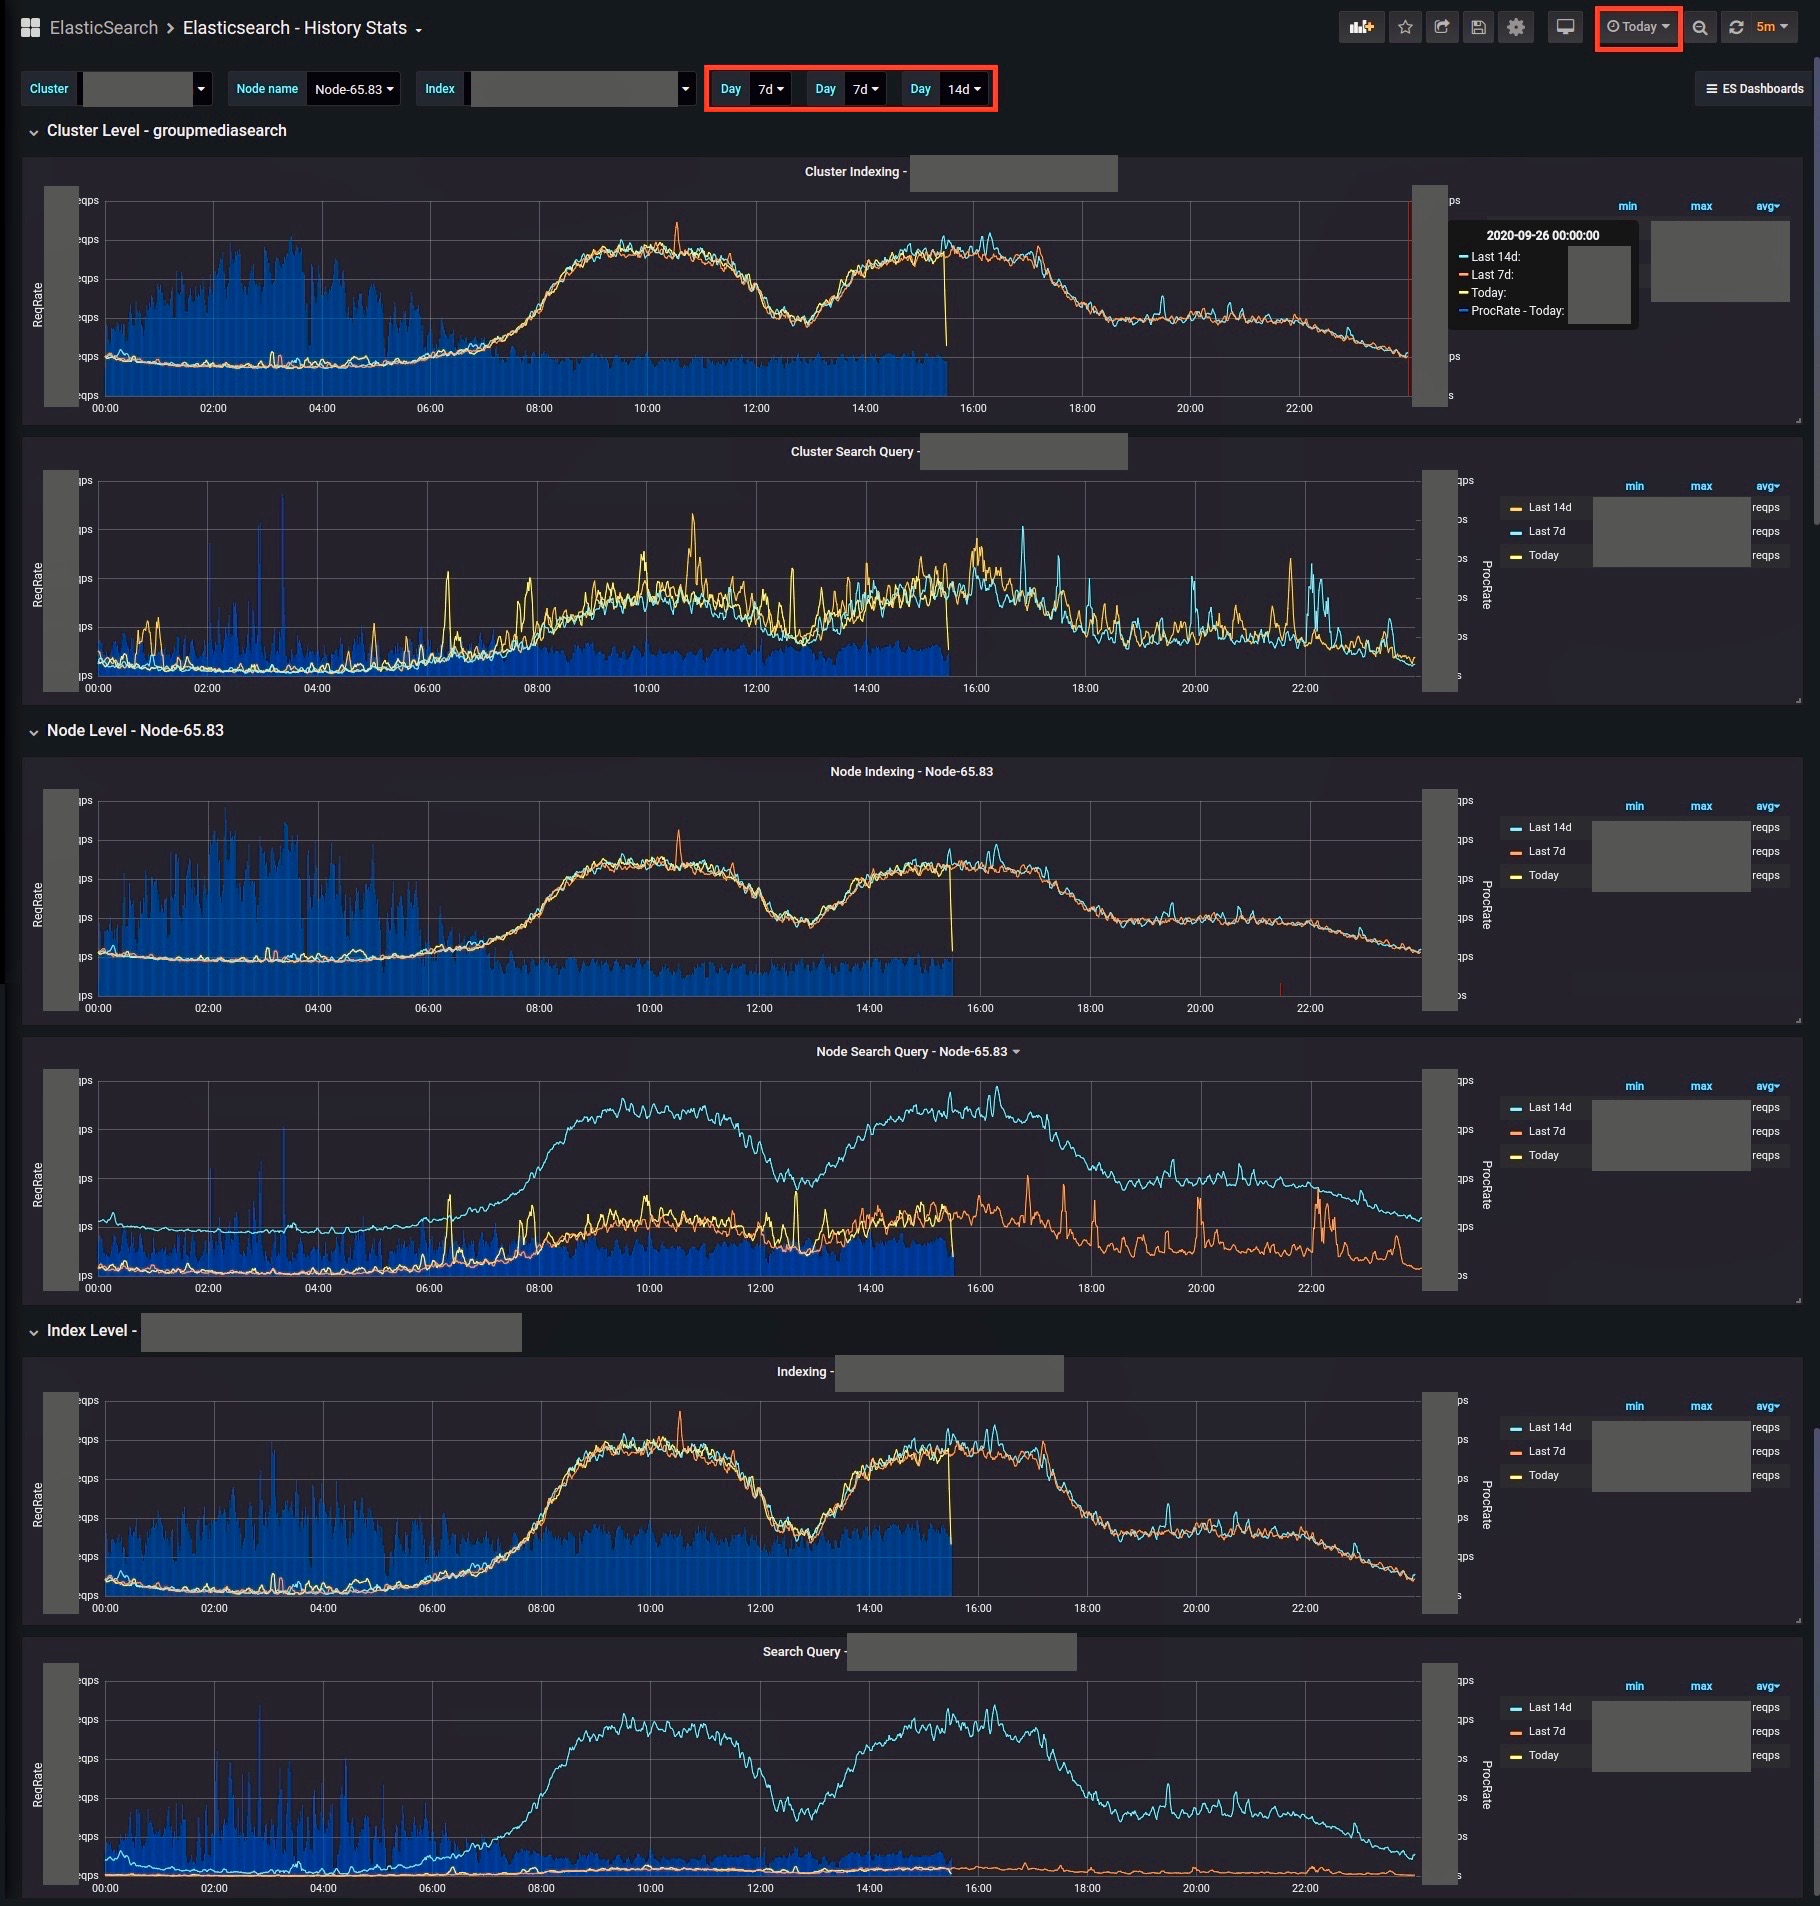
2.4. History Stats Dashboard
3. Conclusion
I have shown you how to monitor Elasticsearch Cluster by using Grafana and Prometheus.
Thanks for reading my article! If you have any feedback or criticism, feel free to leave any comment!